AI Data Studio for the NESO Data Portal
Ask Britain's energy data anything.
PowerBoard turns 129 live NESO datasets into interactive dashboards. Type a question in plain English — the AI inspects the schema, writes the SQL, picks the right chart and builds panels you can edit, save and share.
Free during early access · No spam, ever · We only use your email to send your invite.
- No code, no drag-and-drop
- Live data straight from NESO
- Every chart shows its SQL
How it works
From question to dashboard in one message.
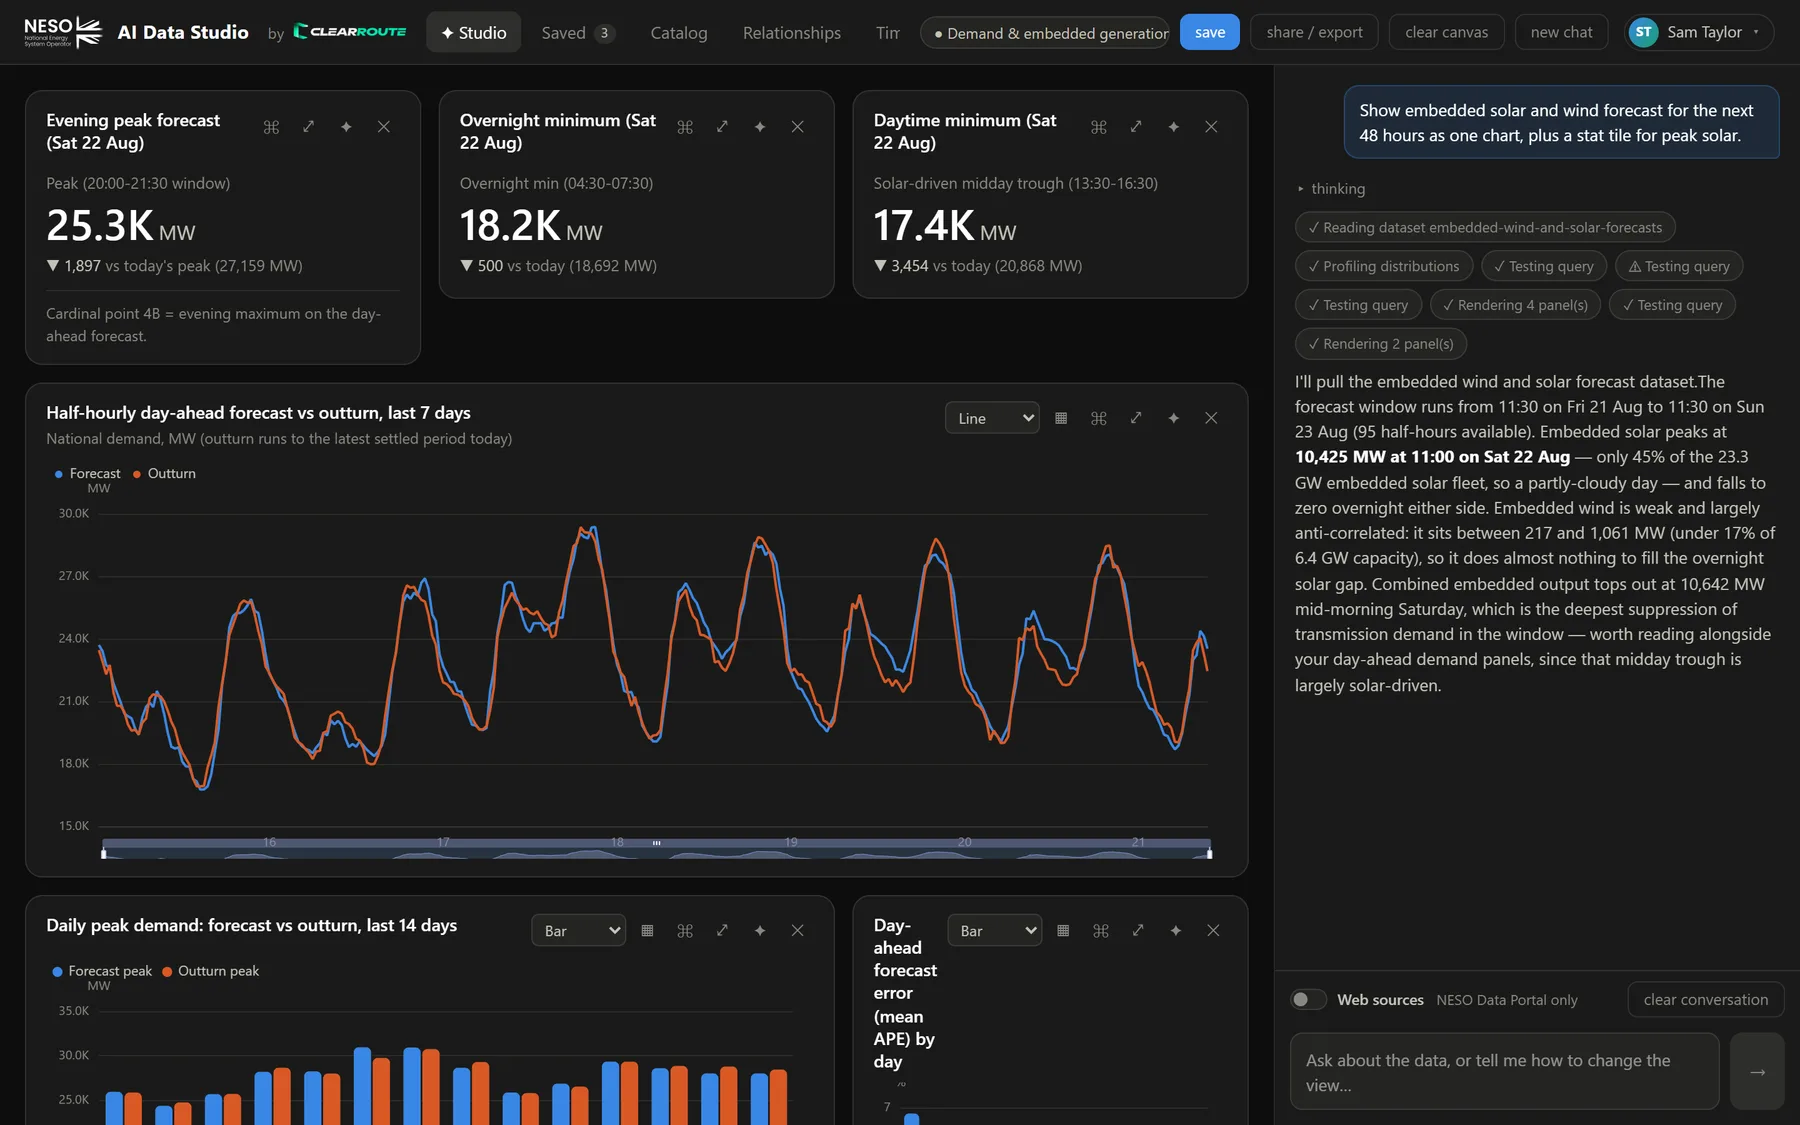
PowerBoard's AI is the primary driver. It doesn't just draw what you ask for — it reads the data first, so the chart form fits the values.
Ask
"Show embedded solar and wind forecast for the next 48 hours as one chart, plus a stat tile for peak solar."
The AI inspects
It reads the dataset, profiles value distributions and sanity-checks its SQL against the live datastore.
Panels appear
Charts, tables, stat tiles and notes stream onto your canvas with a written explanation of what they show.
Refine, save, share
Switch chart forms, flip to the data, send a panel back for refinement, save the canvas or export it as a standalone page.
Features
Everything you need to explore the grid.
Studio — chat with the data
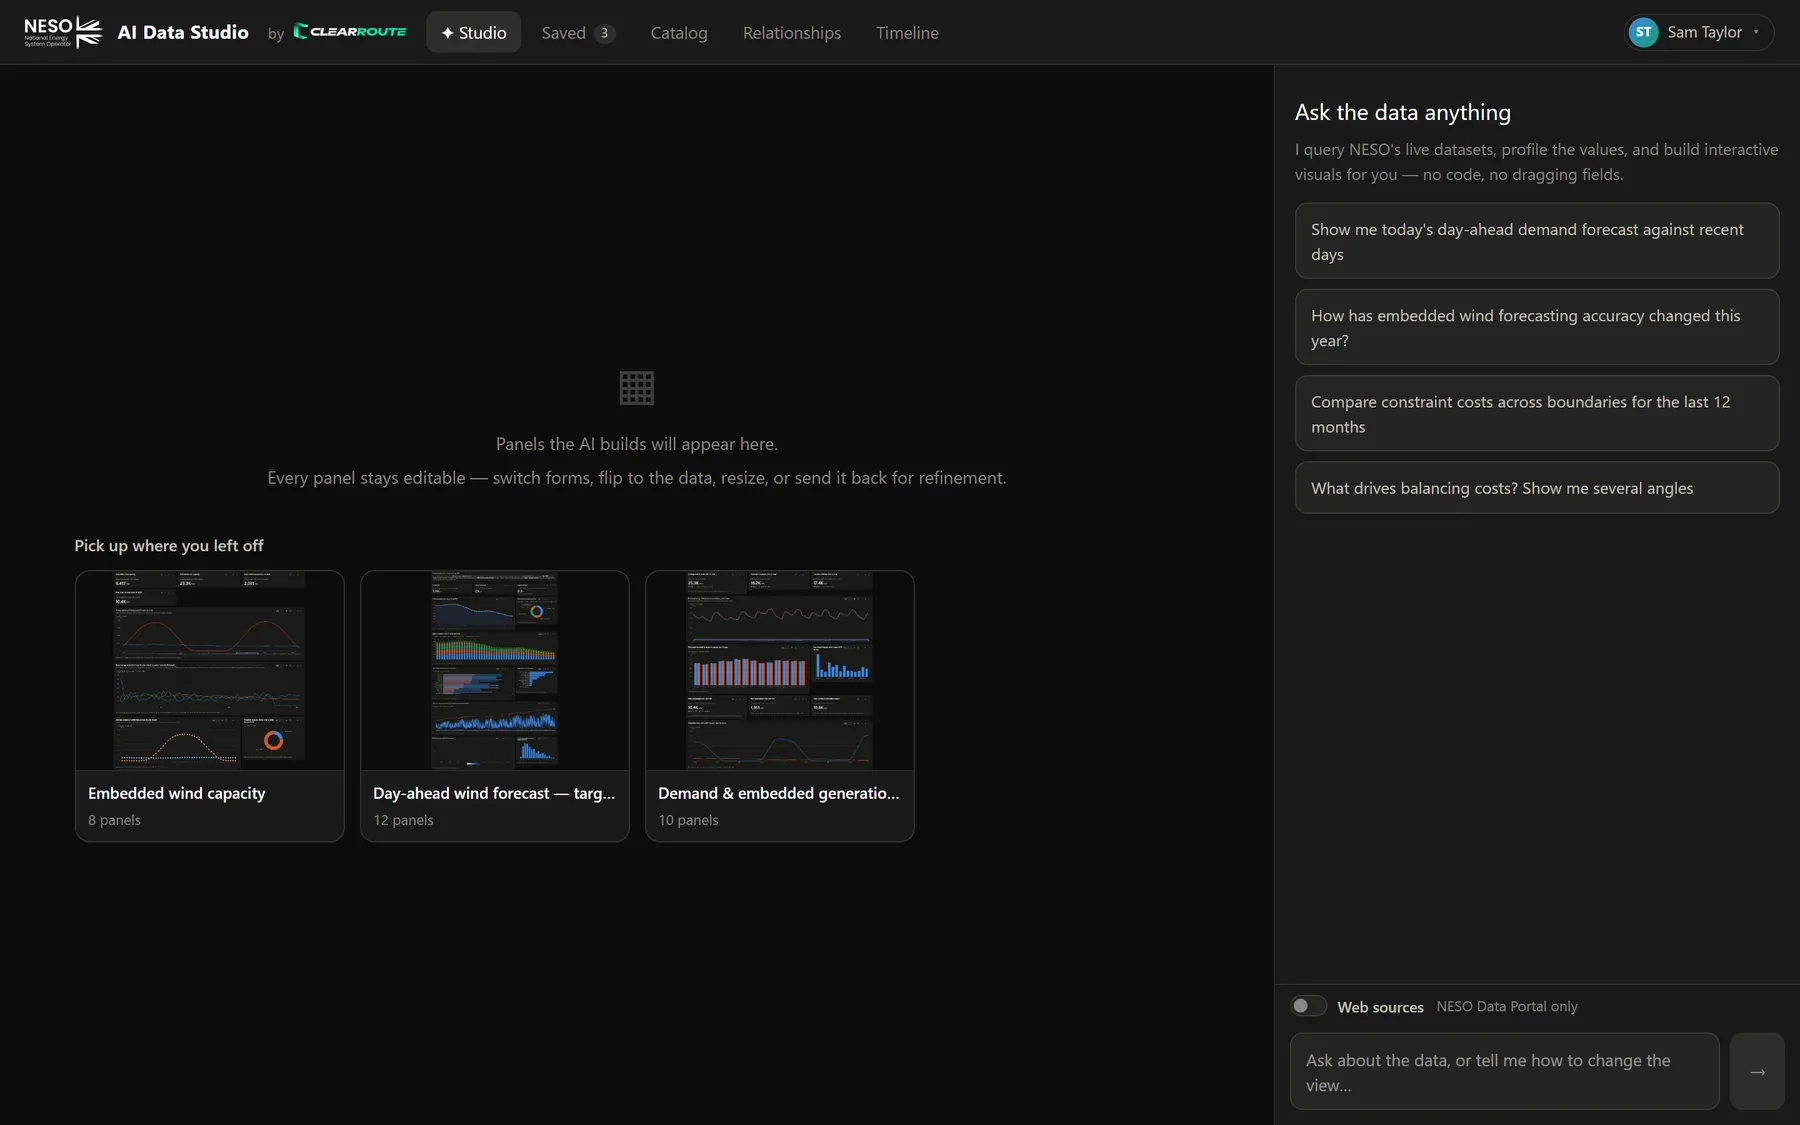
Start with a suggestion or your own question. The AI builds charts, tables, stat tiles and notes onto a canvas, and keeps the conversation going so you can ask "why?" and "what about last year?".
- Conversation and canvas persist across reloads
- Pick up a saved canvas where you left off
- Optional Web sources switch to bring in external CSV/JSON and web research — always cited
Every panel stays yours
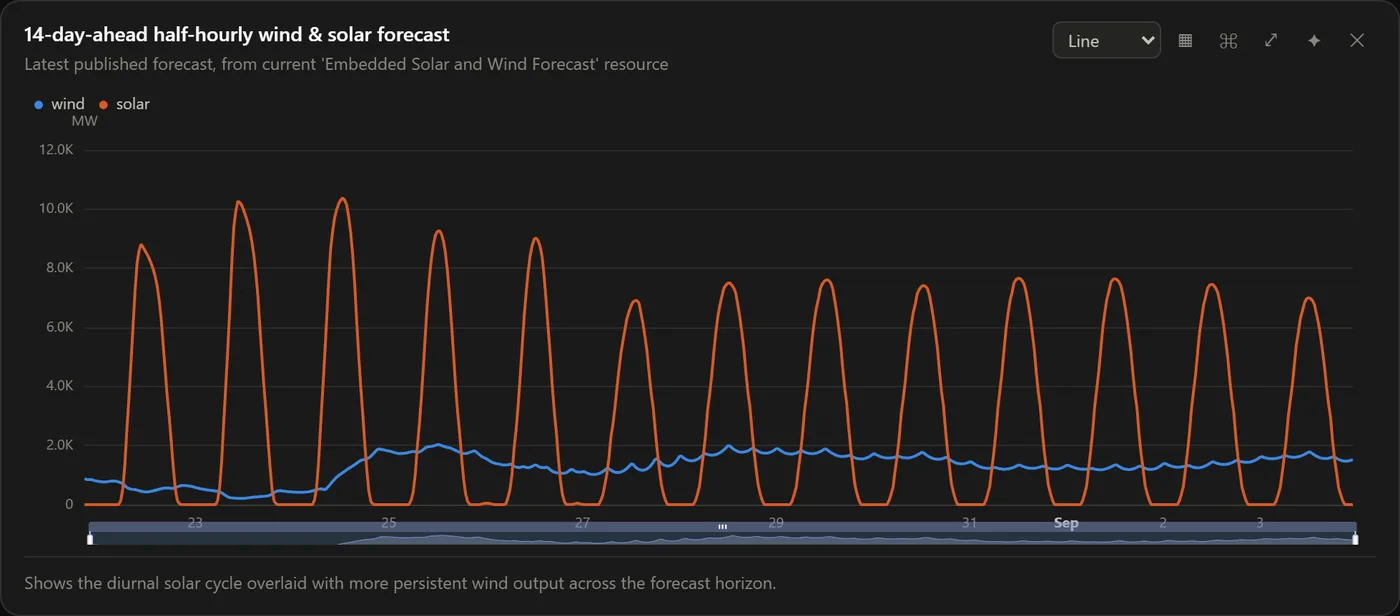
Nothing the AI builds is a dead image. Change the chart form, flip to the underlying rows, read the exact SQL that produced it, resize it, or hand it back to the AI with a note.
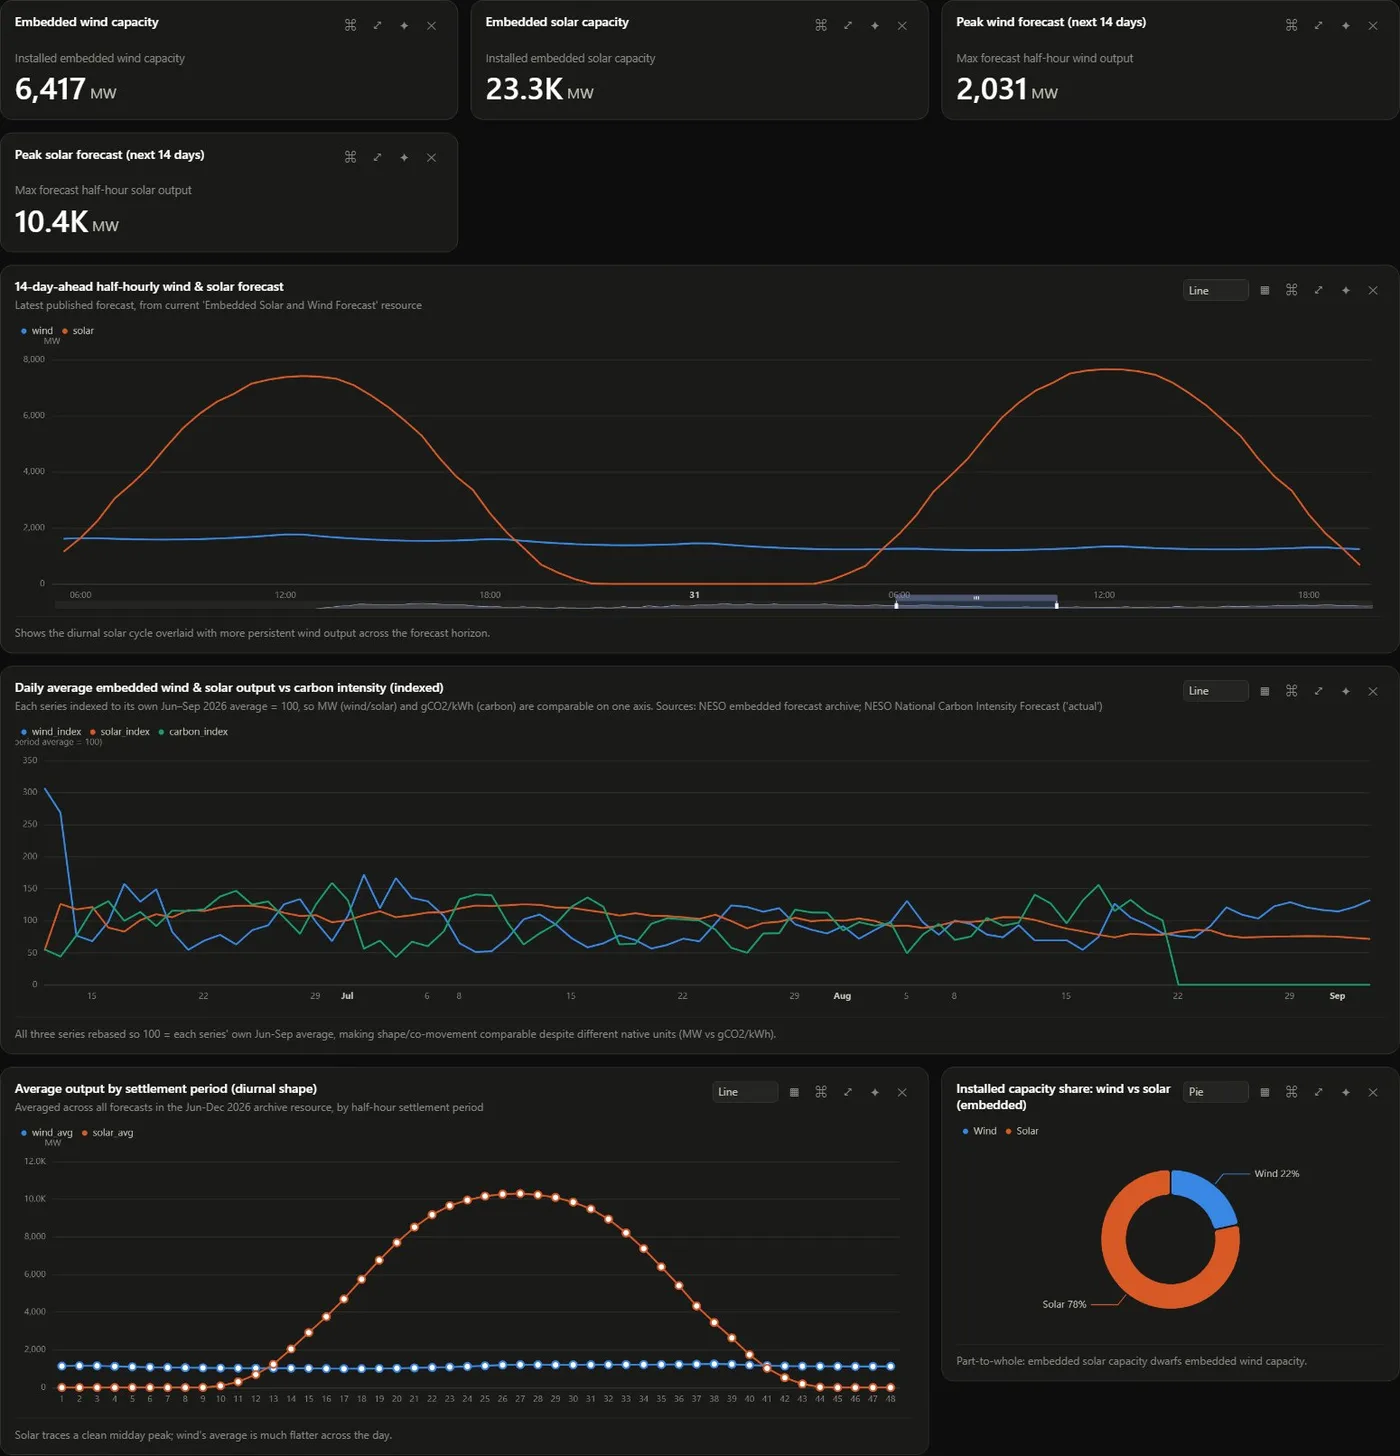
The AI chose a line chart for two half-hourly series.
Catalog — 129 datasets, inspected
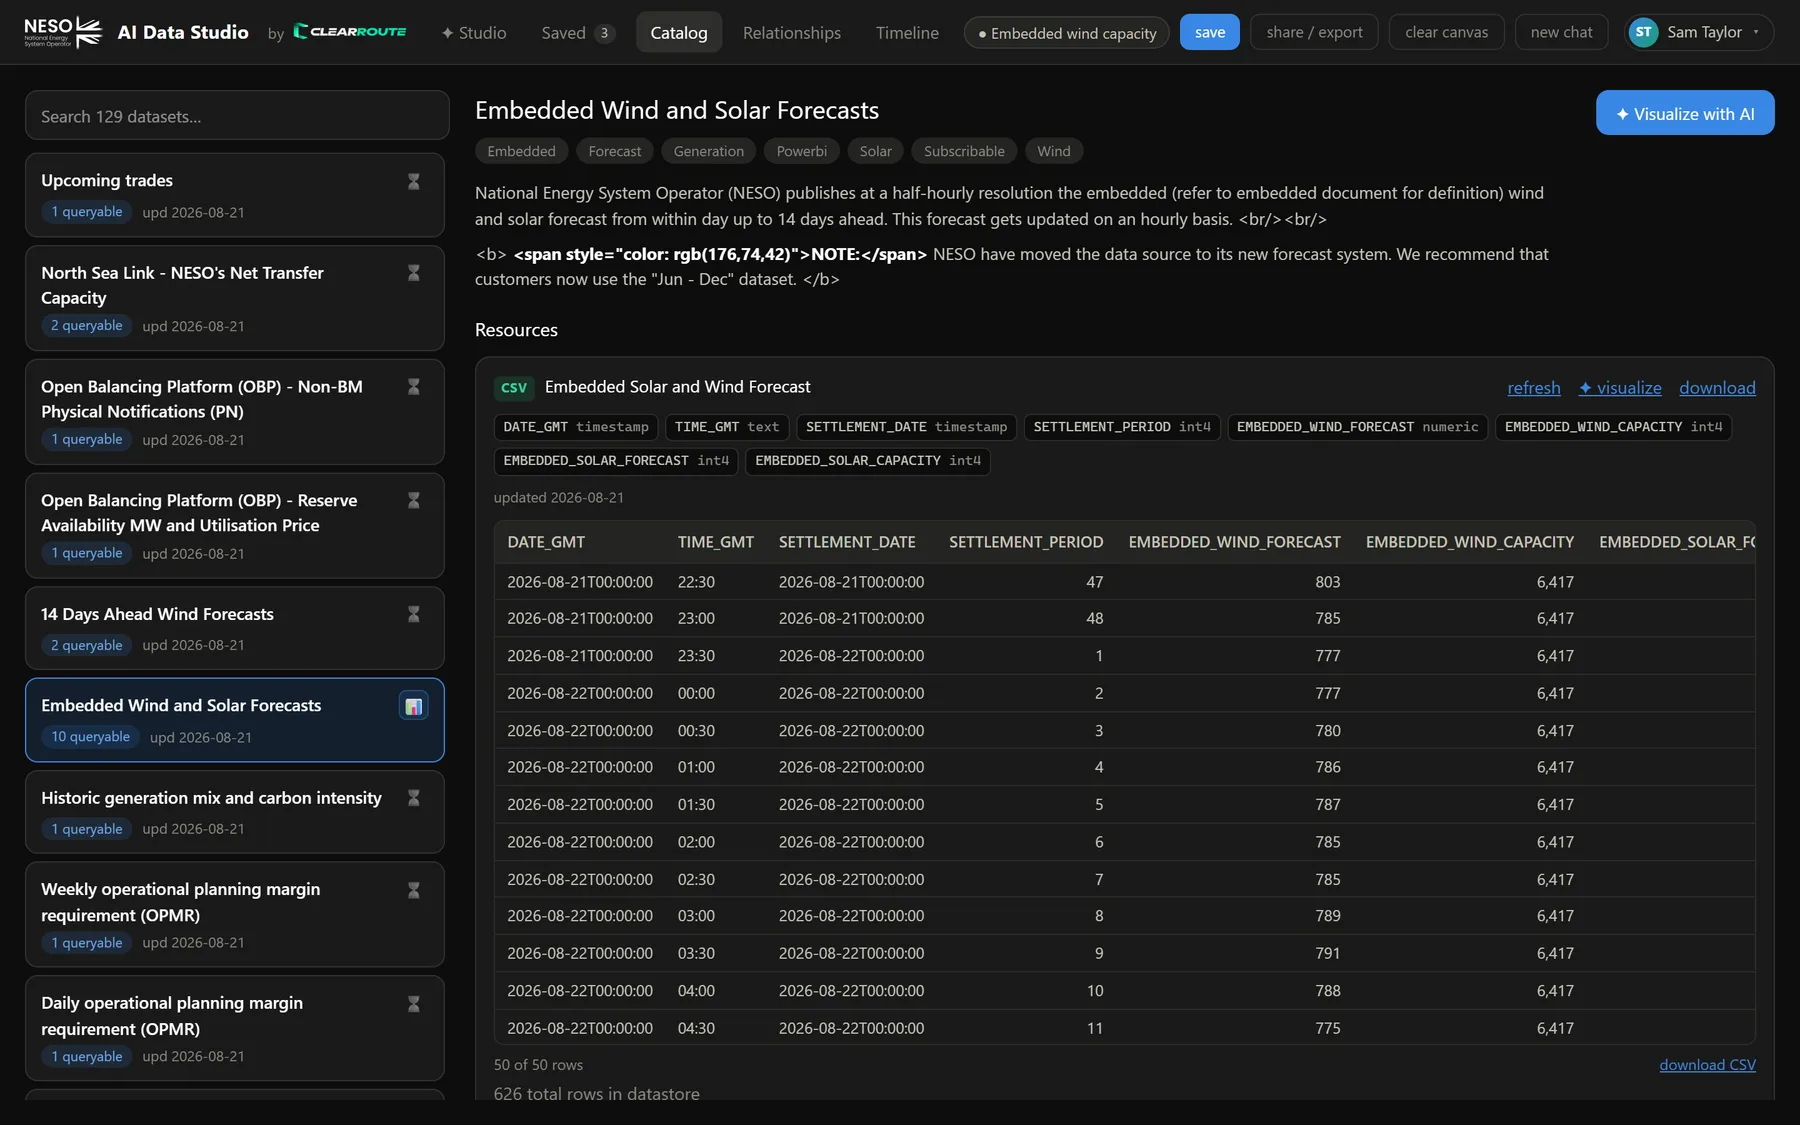
Search every dataset on the NESO Data Portal, see each resource's schema and types, preview live rows, and jump straight to Visualize with AI or Summarize PDF.
- Column names and types for every queryable resource
- Live preview and CSV download from the datastore
- Canvases you've saved for a dataset are one click away
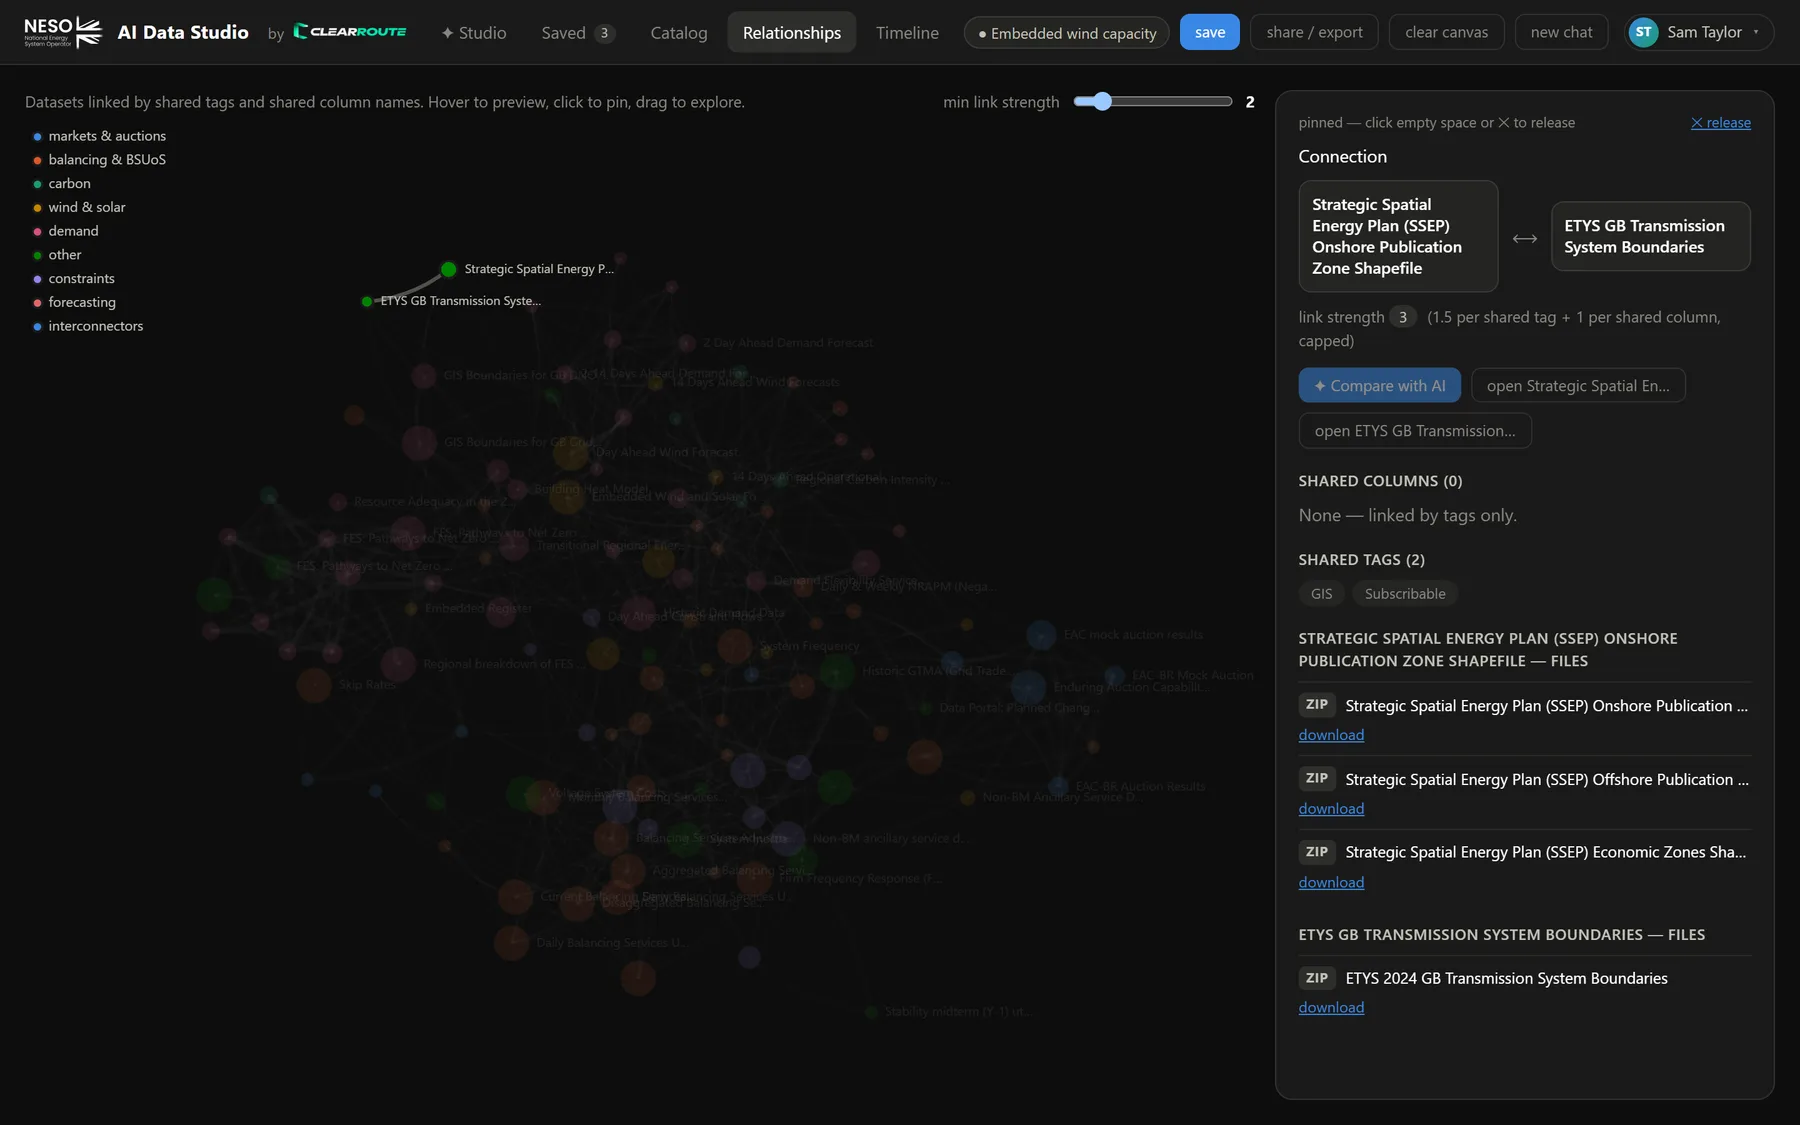
Relationships — see how datasets connect
A force-directed map of the whole portal, linking datasets that share tags and column names. Hover to preview, click to pin, then ask the AI to compare two datasets on the fields they share.
- Link strength from shared tags and columns
- Pin a dataset or a connection for files, downloads and AI actions
- Filter by minimum link strength
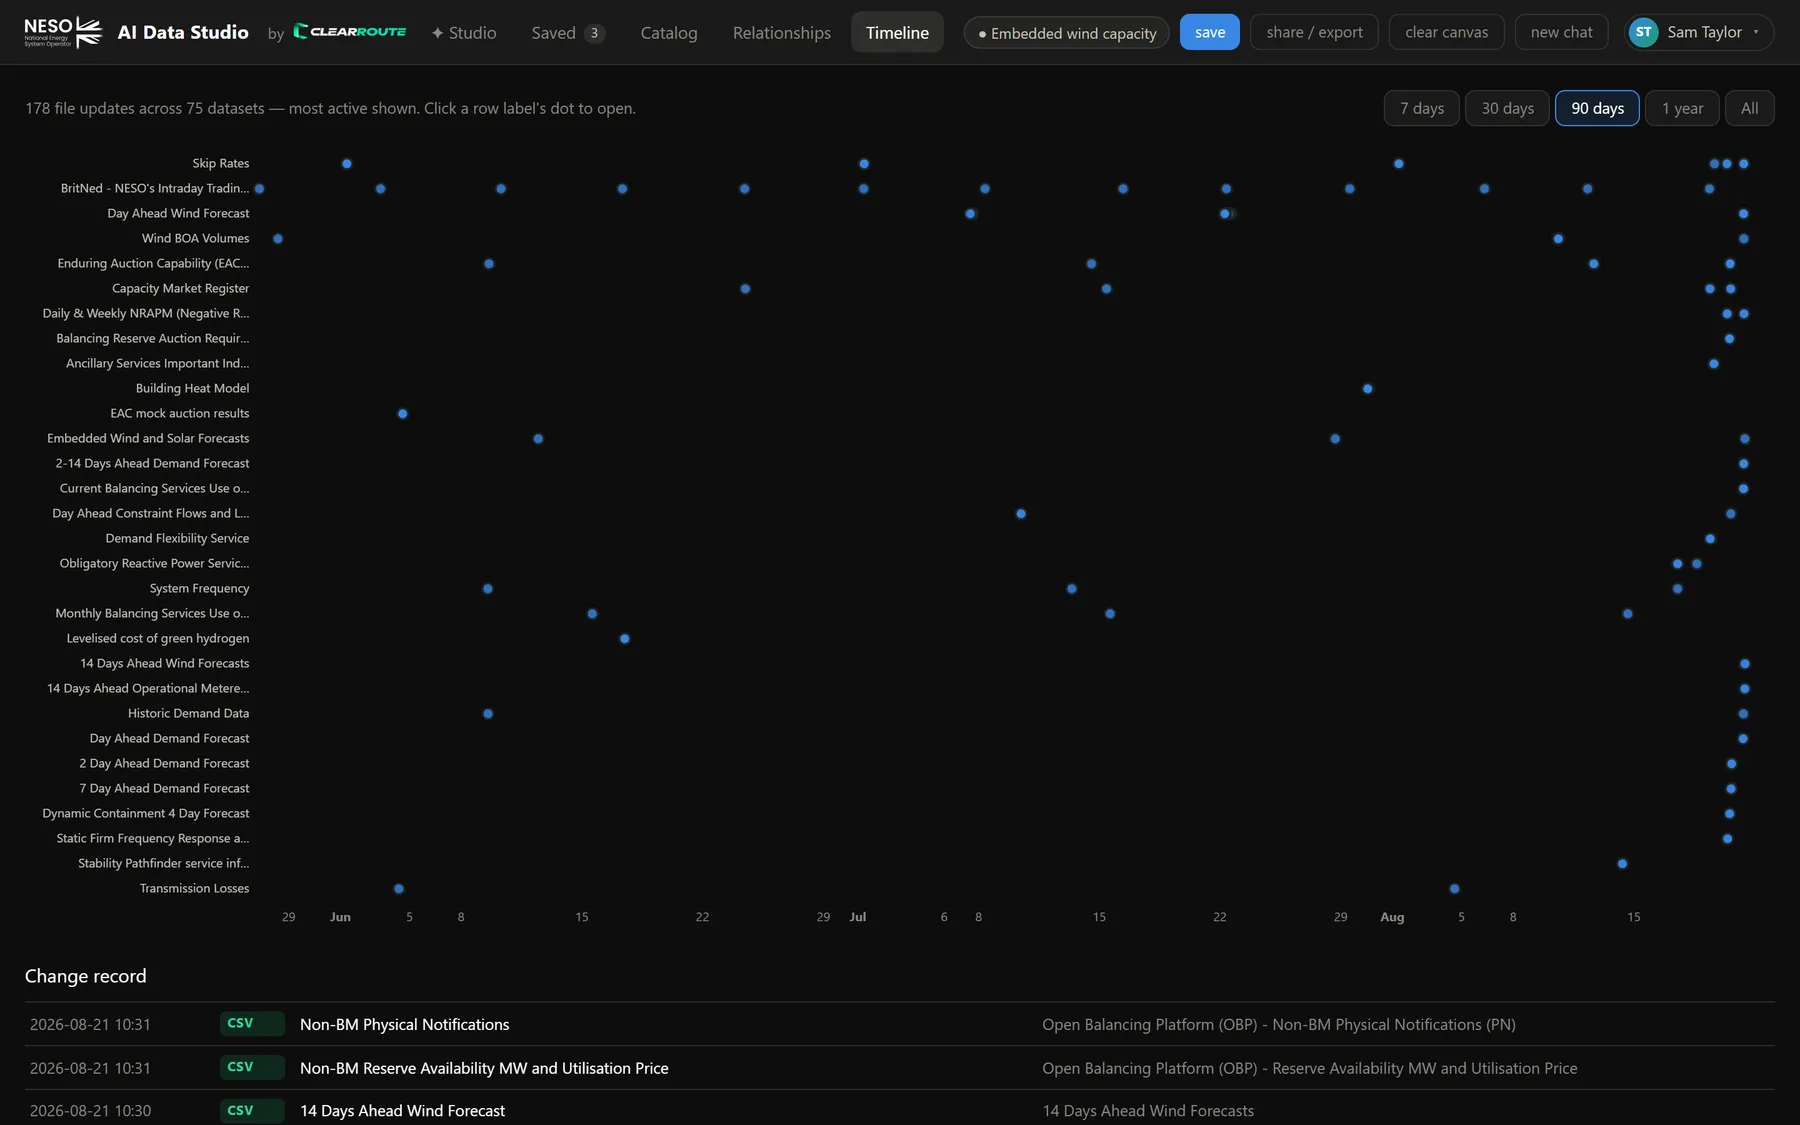
Timeline — know what's fresh
An activity dot-plot of when every file was last updated, with a change record underneath. Spot stale sources before you build on them.
- 7-day to all-time ranges
- Click a row to open the dataset
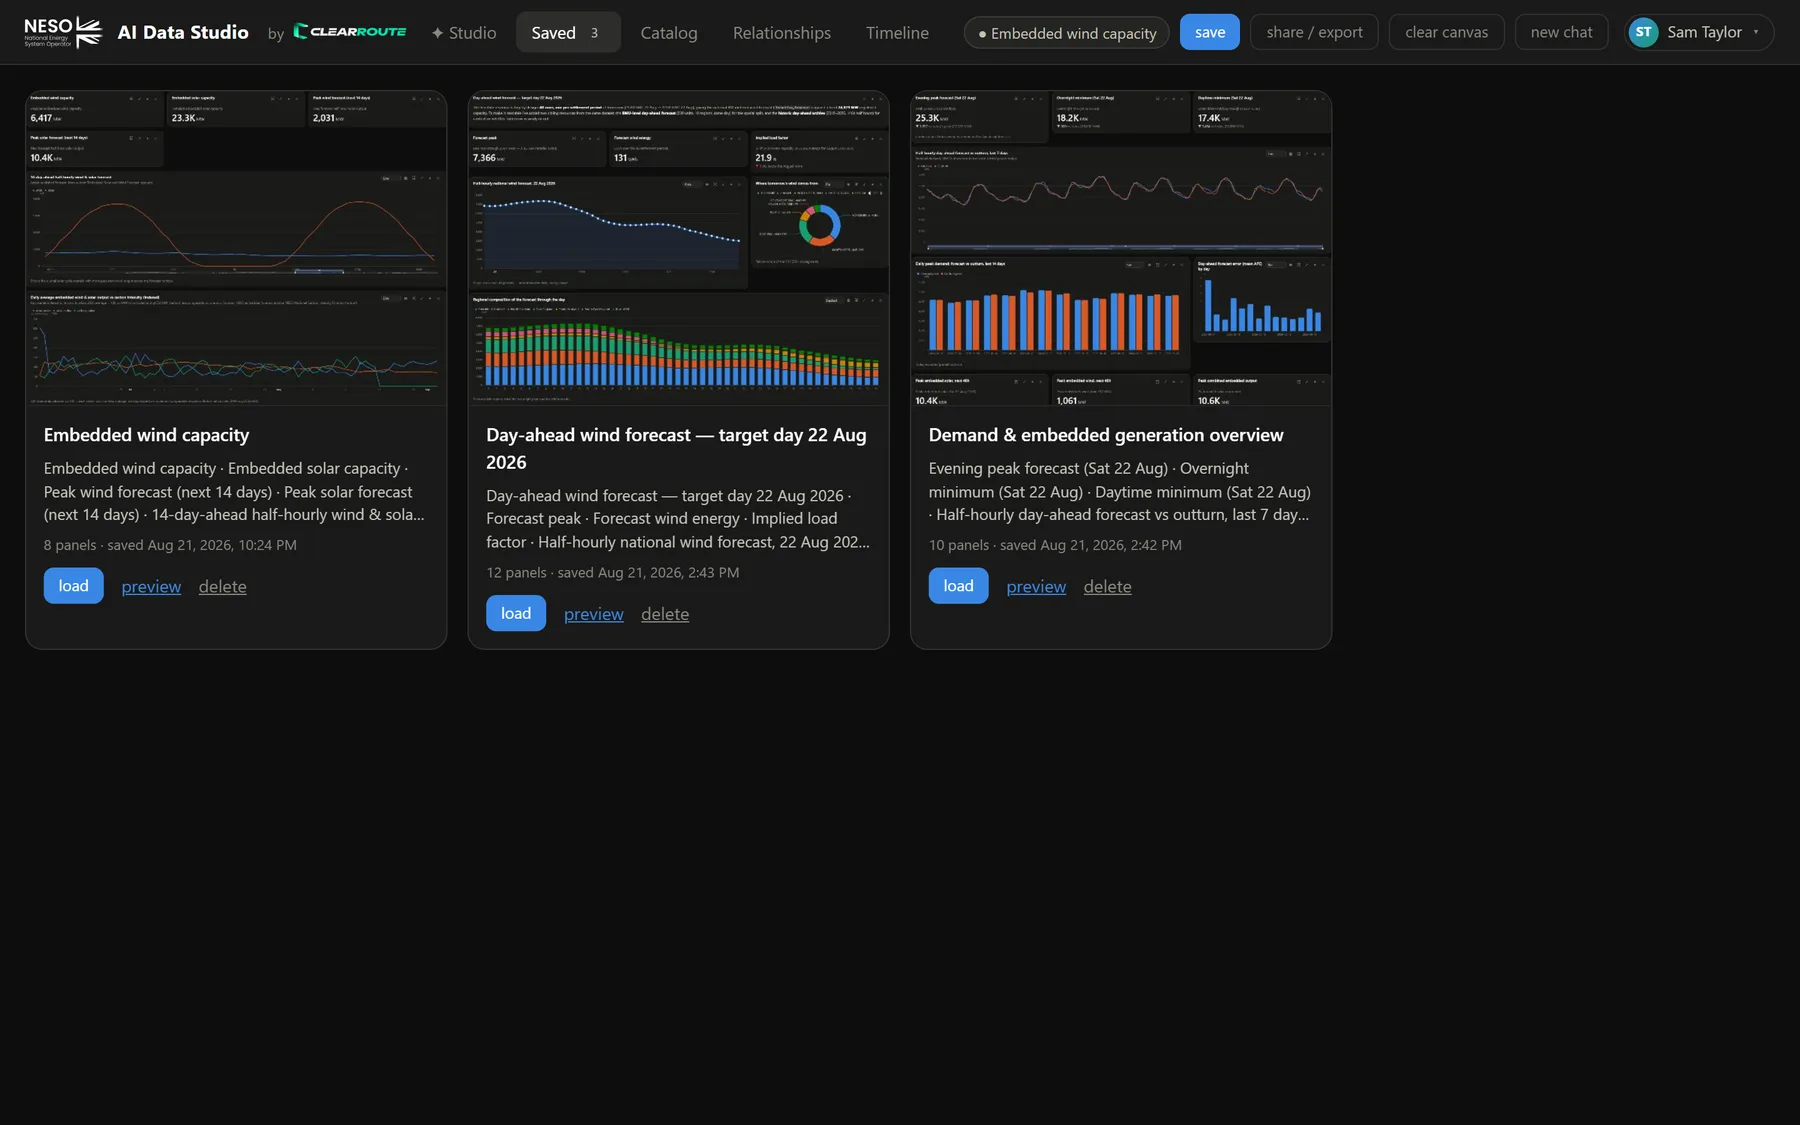
Save, resume, share
Save a canvas with its data, its conversation and a snapshot. Load it later and the AI still has the context. When it's ready, export a standalone HTML page anyone can open — no login required.
- Gallery of saved canvases with full-size previews
- Update in place or save as new
- Share / export as a single self-contained file
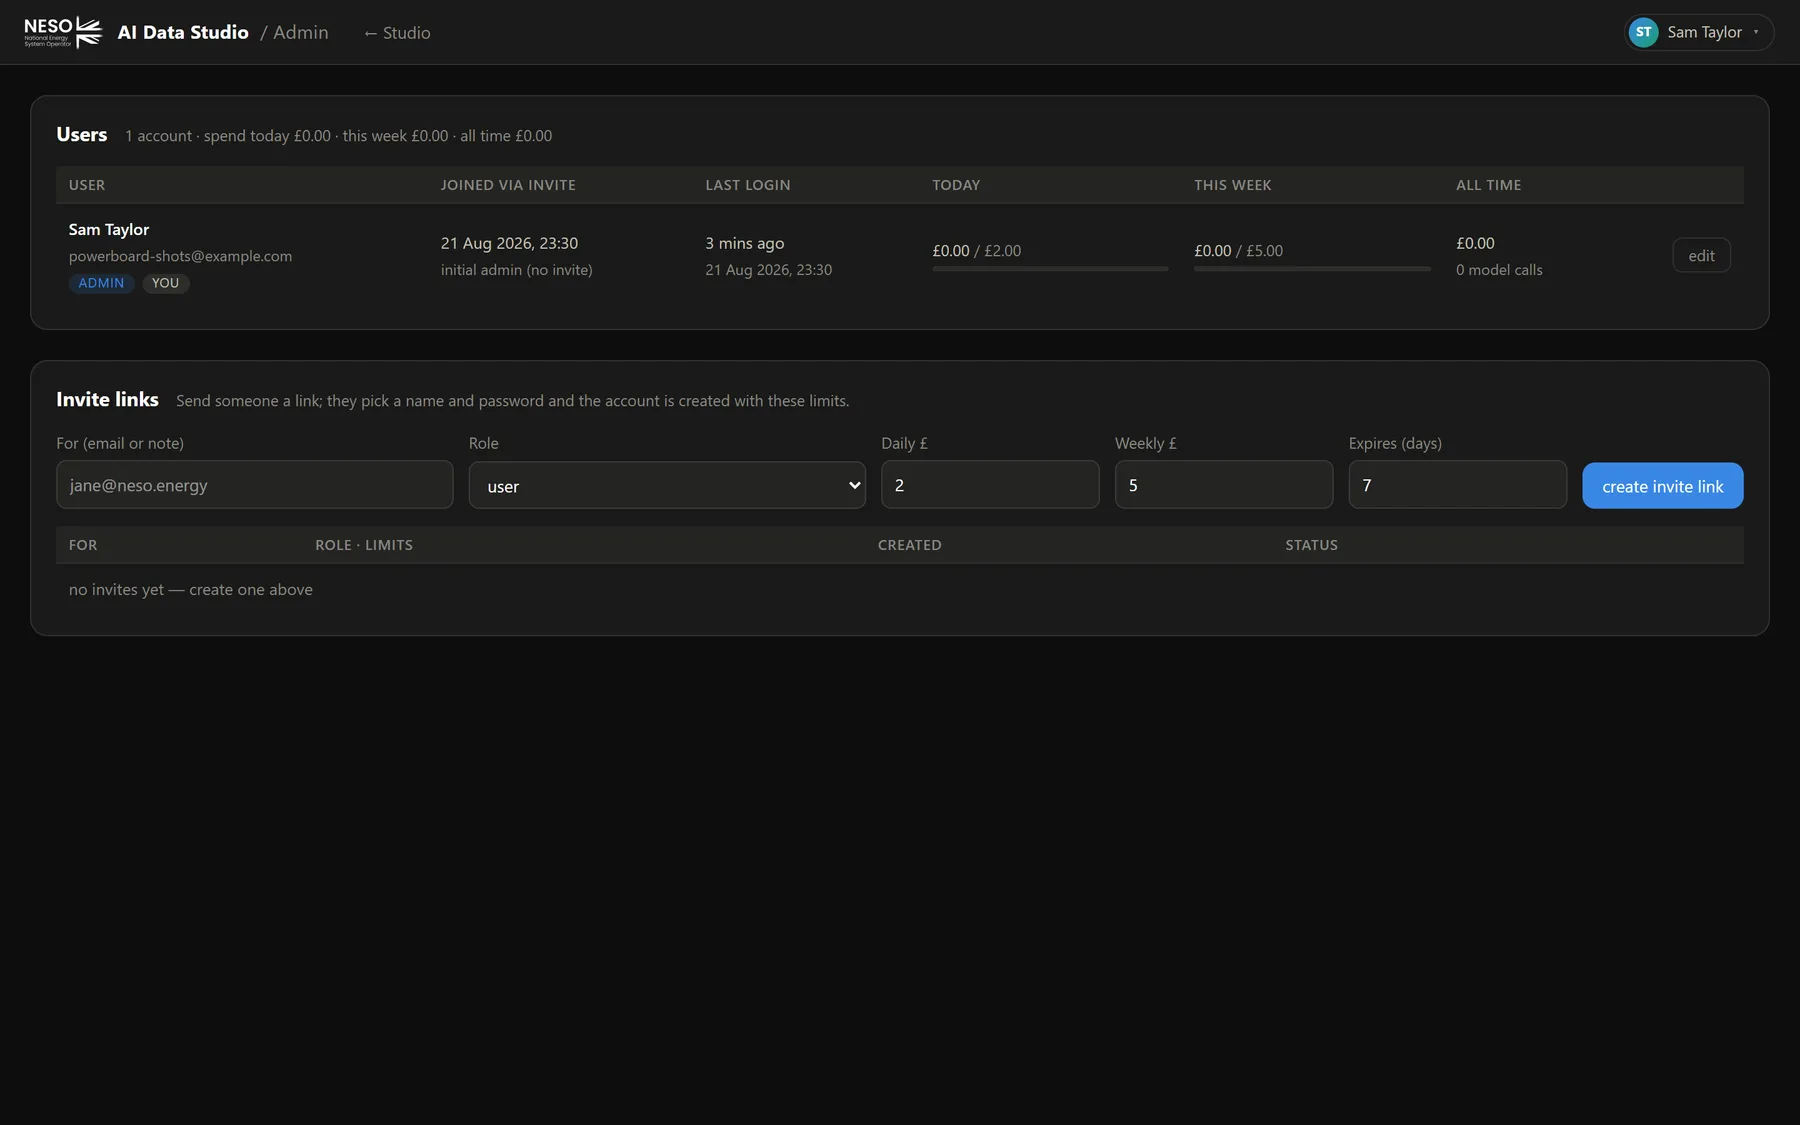
Built for teams
Invite colleagues with a link, give each person a daily and weekly AI budget in pounds, and see spend at a glance. Nobody gets a surprise bill.
- Invite links with role and limits
- Per-user daily / weekly budgets
- Spend and model-call tracking
Why PowerBoard
Answers in minutes, charts you can trust.
Minutes, not days
No waiting on an analyst or wiring up a BI tool. Ask, and a working dashboard is on screen while you're still thinking of the next question.
Trustworthy by design
Every panel shows its SQL. House dataviz rules are enforced — no dual axes, capped series, honest scales — so a chart can't mislead you.
Always live
Queries run against NESO's datastore at the moment you ask. Forecasts, outturn, balancing costs — whatever was published most recently.
Editable, not disposable
AI output is a starting point. Change forms, resize, flip to data, or send a panel back with a note. You stay in control.
Share without friction
Export a canvas as a single HTML file. Colleagues open it in a browser — interactive charts included, no account needed.
Costs under control
Per-user daily and weekly budgets, visible in the app and the admin page. Experiment freely inside a limit you set.
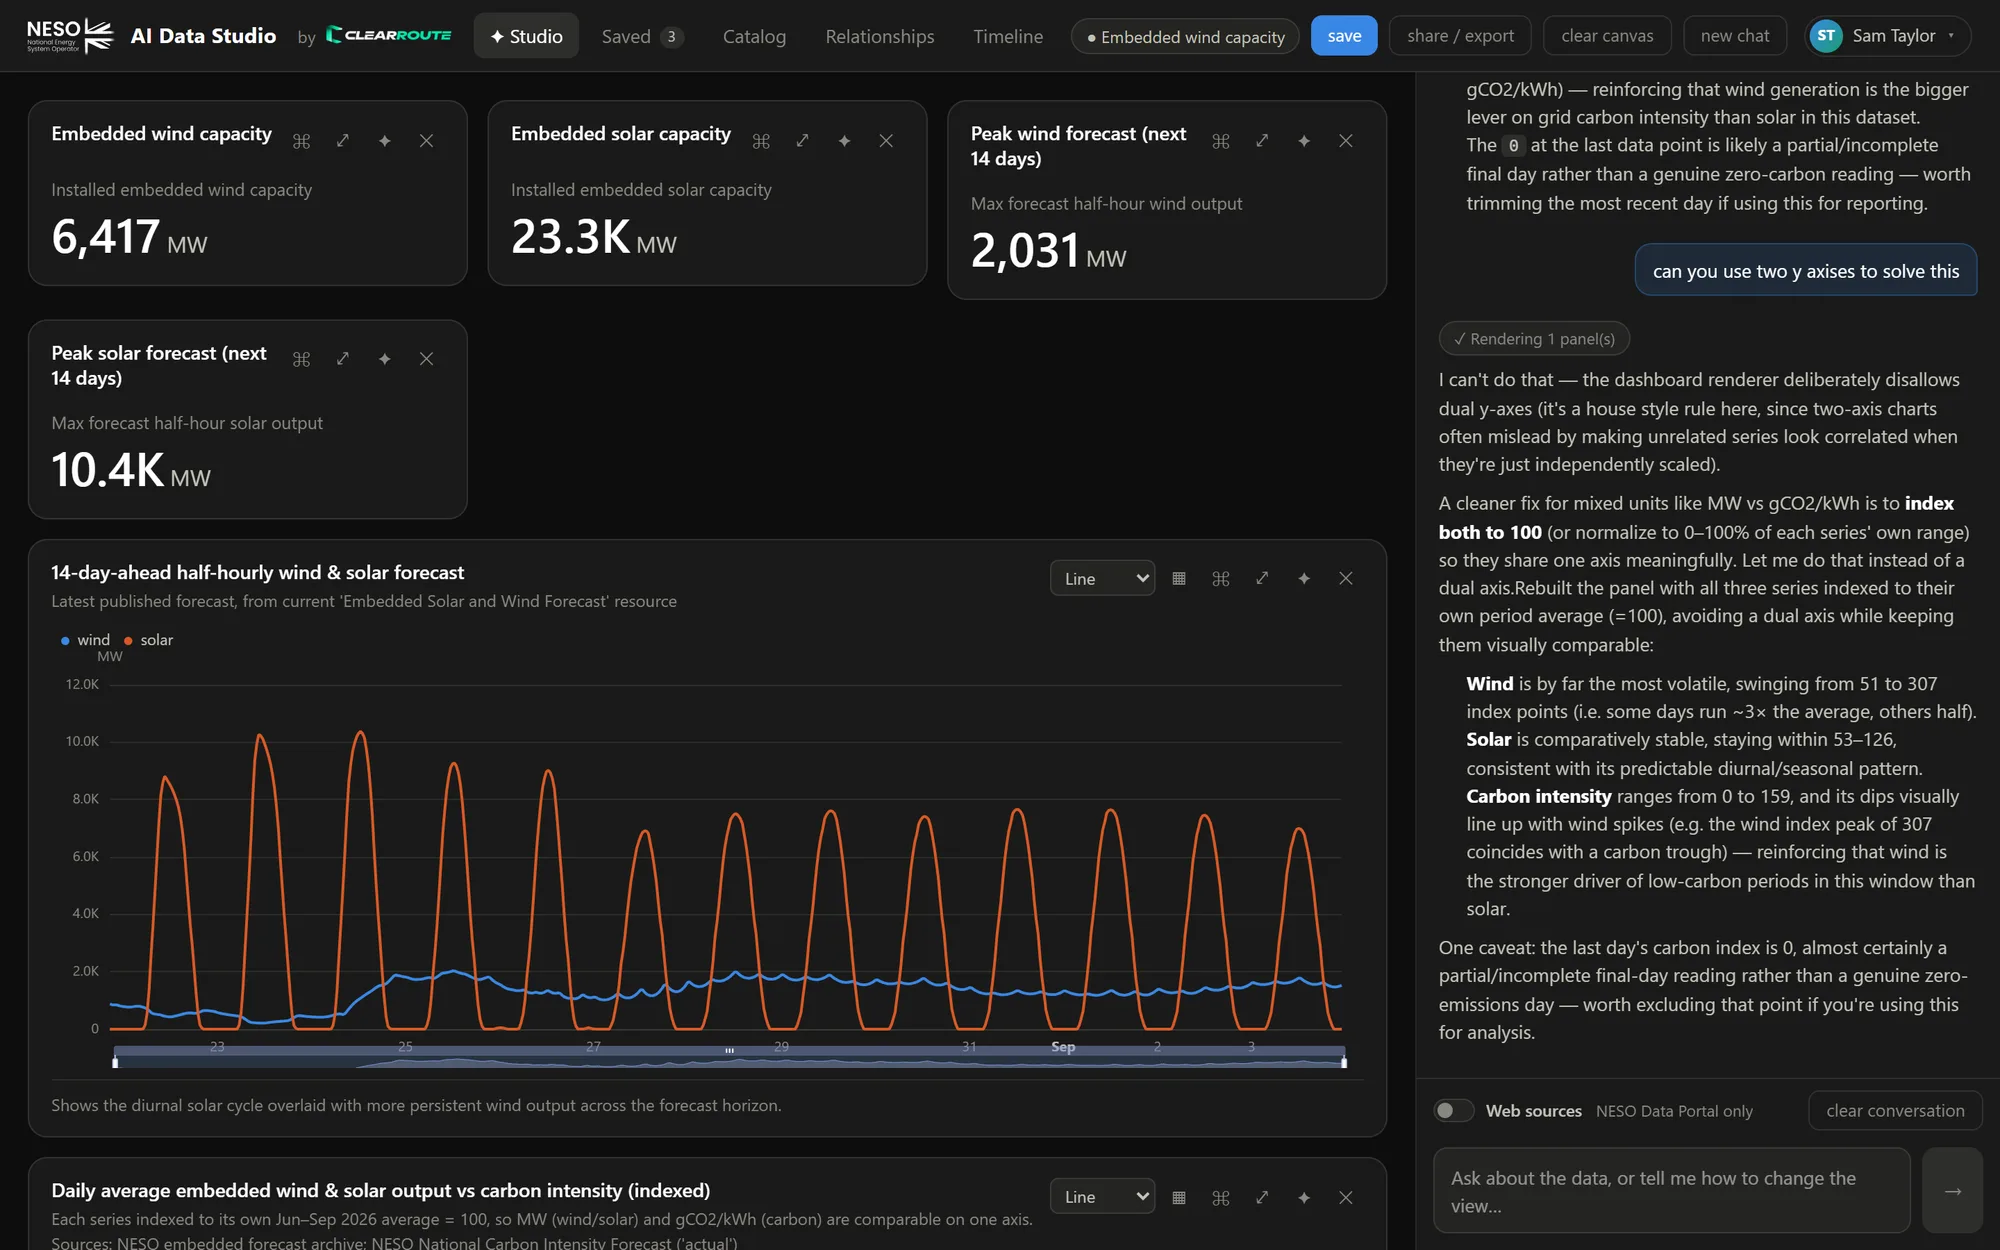
"I can't do that — the dashboard renderer deliberately disallows dual y-axes… A cleaner fix for mixed units is to index both to 100 so they share one axis meaningfully."
Gallery
Real canvases, built from real questions.
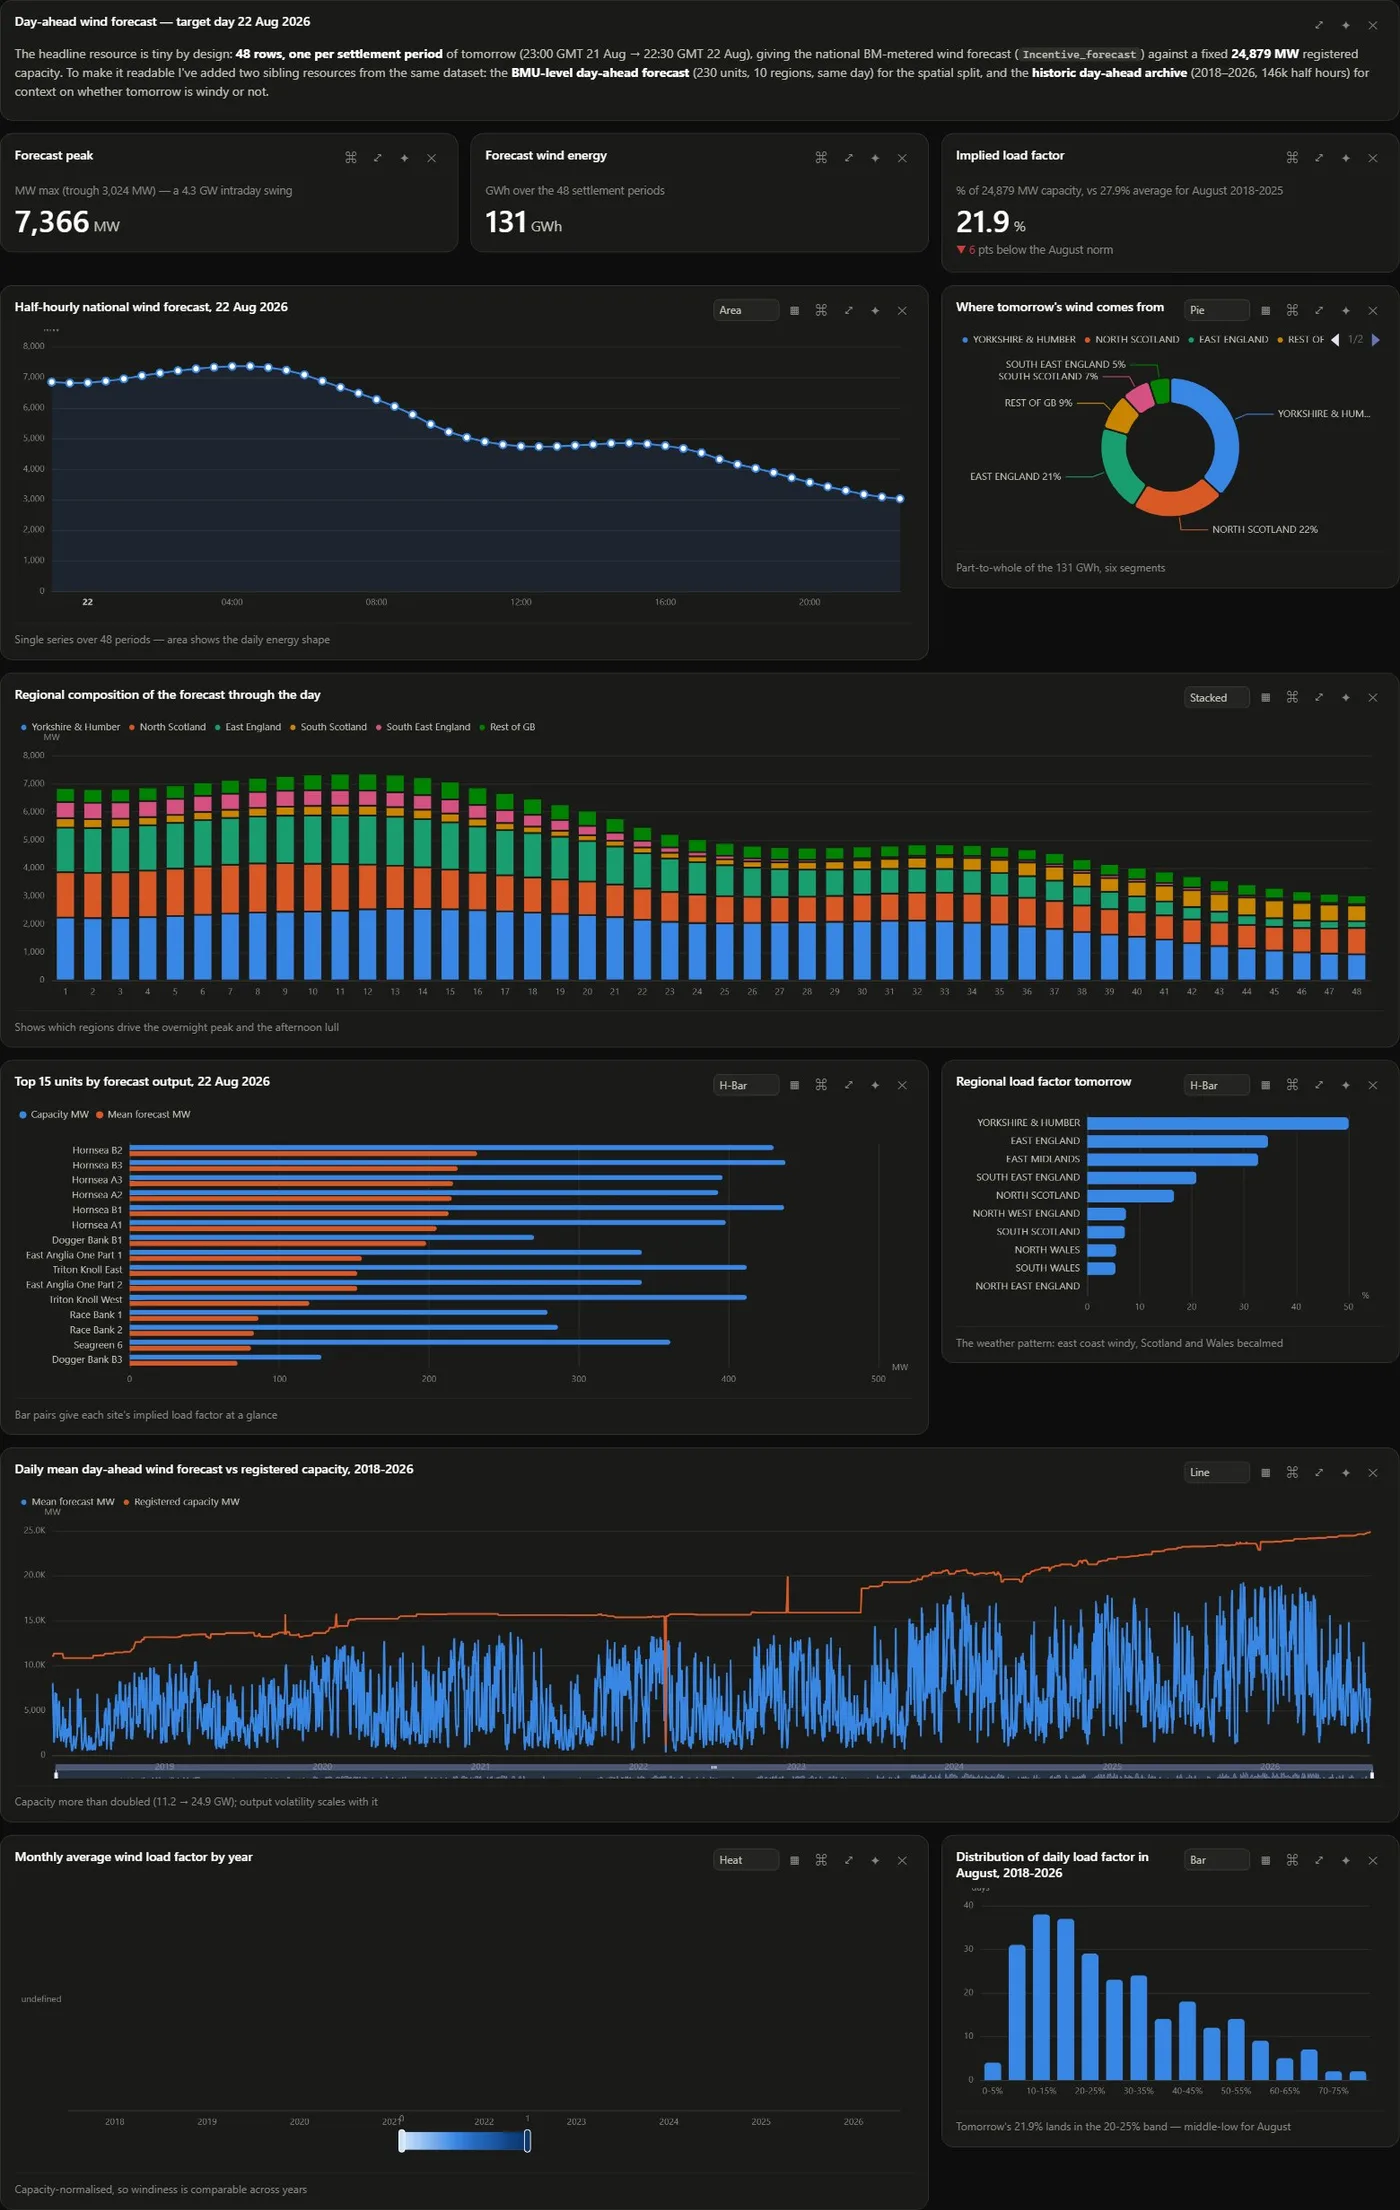
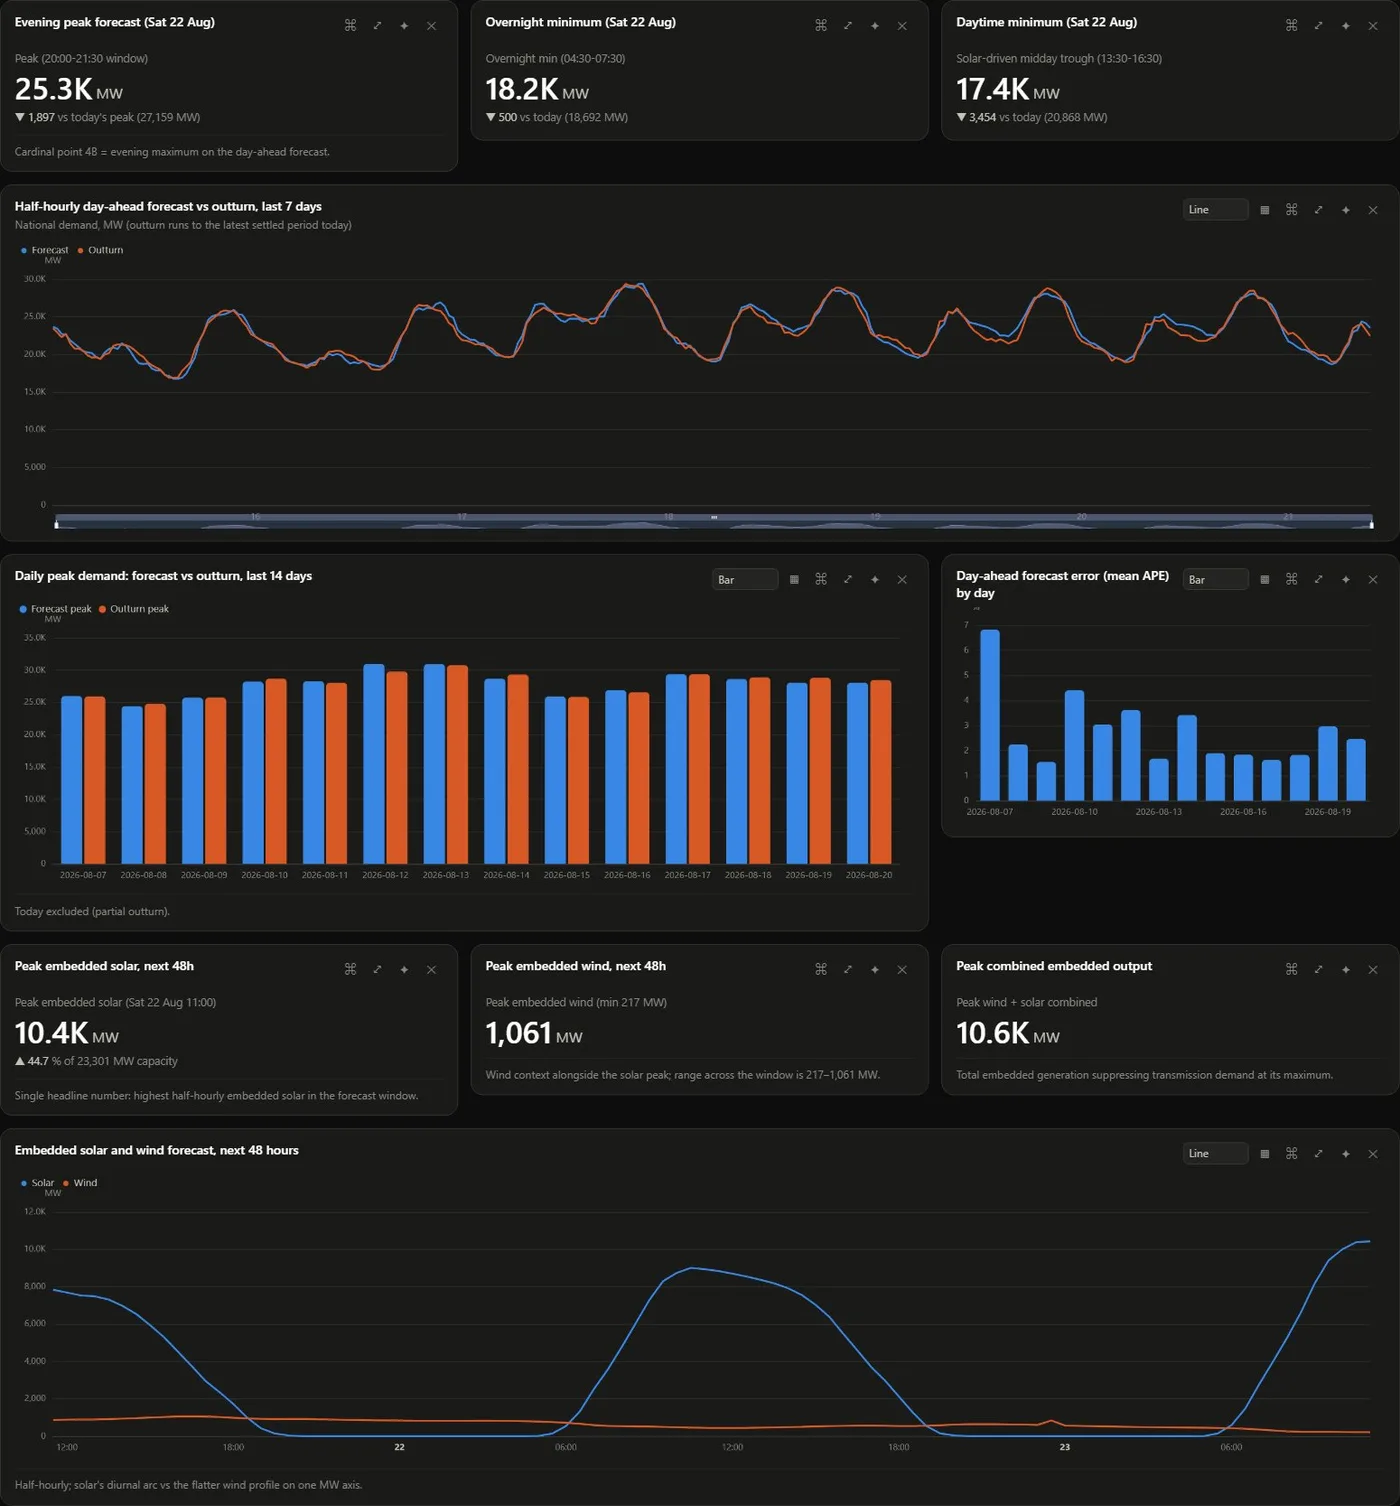
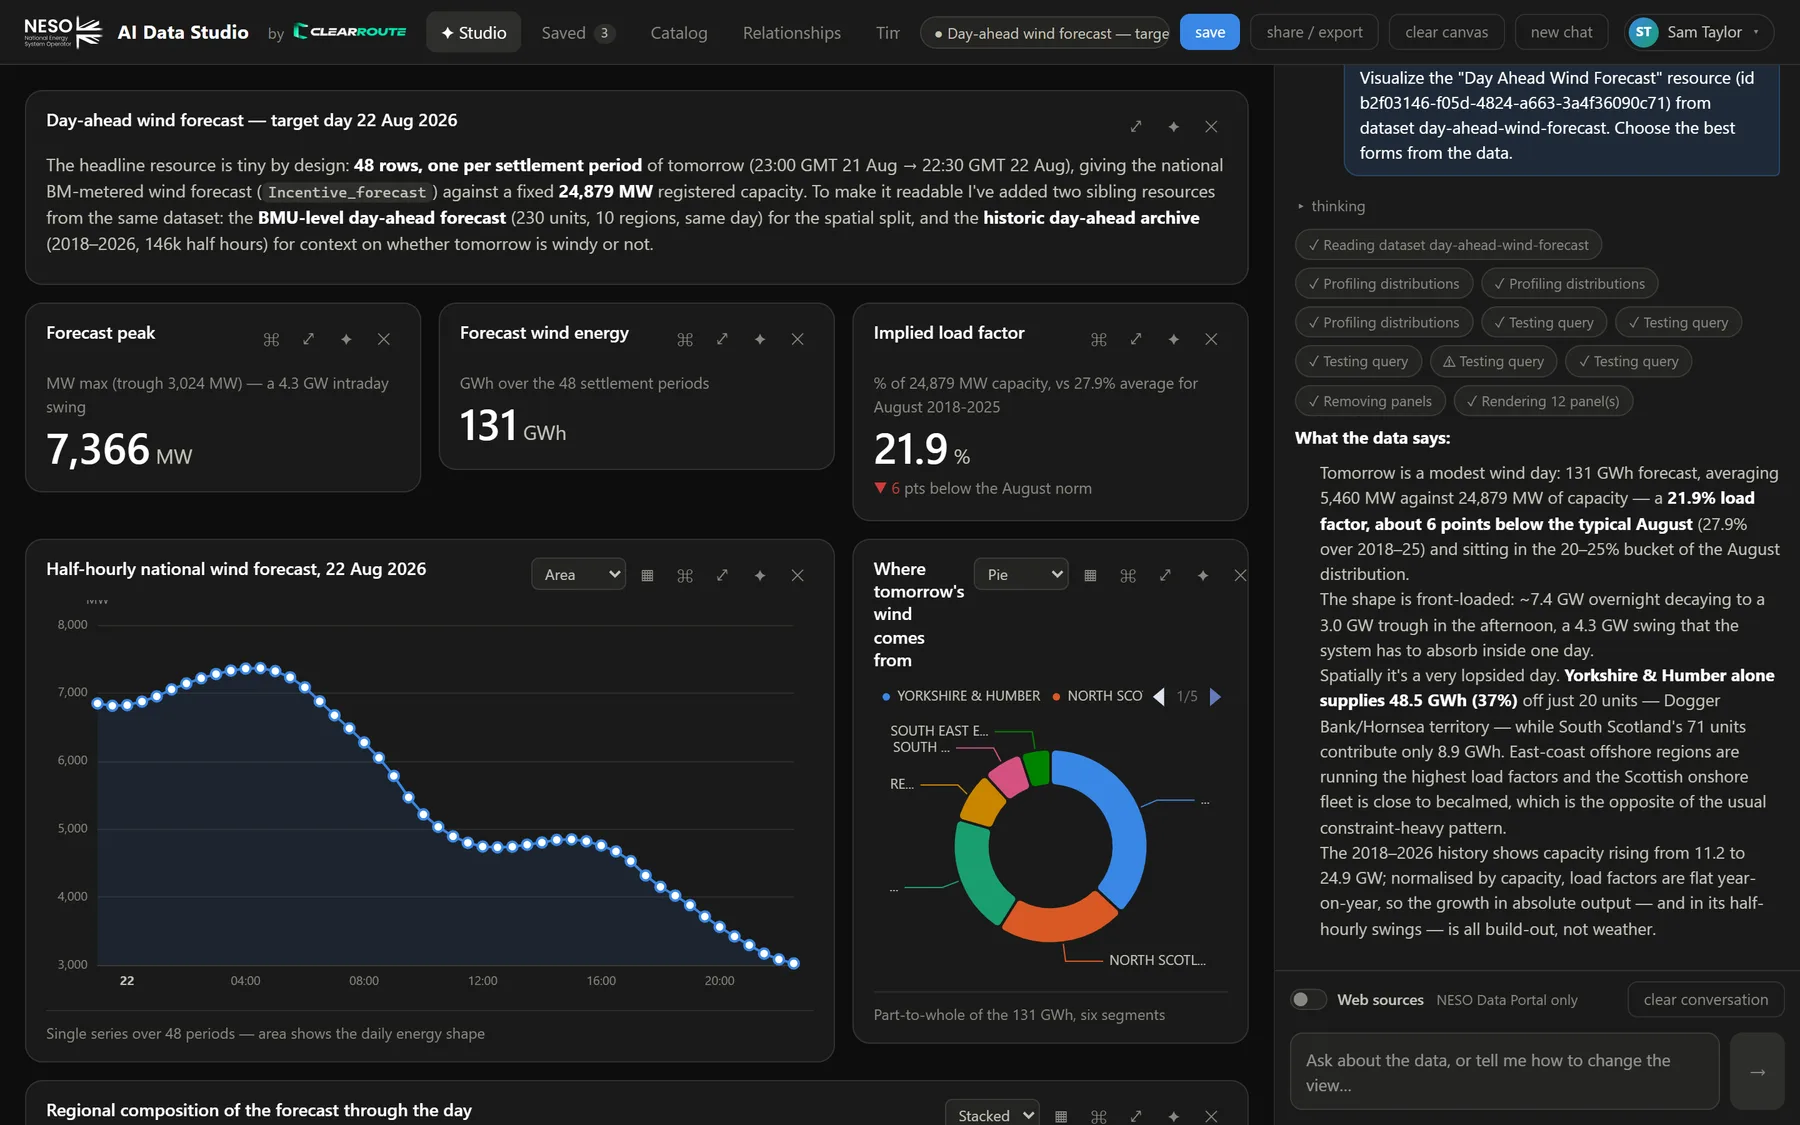
Each of these was produced in a single conversation. Click to open the full-size snapshot.
FAQ
Good questions.
What data can I explore?
Everything published on the NESO Data Portal — 129 datasets covering demand and generation forecasts, balancing services and costs, carbon intensity, constraints, interconnectors, markets and more. Queries run against NESO's live datastore, so you always see the latest published values.
Do I need to know SQL or a BI tool?
No. You ask in plain English. The AI writes and tests the SQL and chooses a chart form from the shape of the data. If you do know SQL, every panel shows the exact query it ran.
How is this different from asking a general chatbot?
PowerBoard is wired directly into the datastore. It profiles real value distributions before choosing a visual, executes queries server-side, and renders interactive panels you can edit — rather than describing a chart it can't actually build from your data.
Can I share what I build?
Yes. Save a canvas to return to it (the conversation comes back too), or export it as a standalone HTML page with interactive charts that anyone can open without an account.
What does it cost?
PowerBoard is free during early access. Admins set a daily and weekly AI budget per user, so usage is always predictable.
How do I get access?
Leave your email below. We're onboarding in small groups and will send you an invite link when your seat is ready.
Early access
Your first dashboard is one question away.
Join the early-access list and we'll email you an invite link as seats open up.
We'll only use your address to send your invite.